Overview
Today we start the fun stuff - data visualization. We will cover how to build plots with the package ggplot2 (part of the tidyverse): I will lecture for the first half (again, it will be a lot of information that you can refer back to as needed over the semester) and you will practice making plots.
Readings
- Ch.3 in Wickham & Grolemund, R for Data Science
On ggplot2
- R Studio’s ggplot2 Cheat Sheet
ggplot2’s website reference section- Hadley Wickham’sR for Data Science book chapter on ggplot2
- STHDA’s be awesome in ggplot2
- r-statistic’s top 50 ggplot2 visualizations
On data visualization
- Kieran Healy’s Data Visualization: A Practical Guide
- Claus Wilke’s Fundamentals of Data Visualization
- PolicyViz Better Presentations
- Karl Broman’s How to Display Data Badly
- I Want Hue
Slides
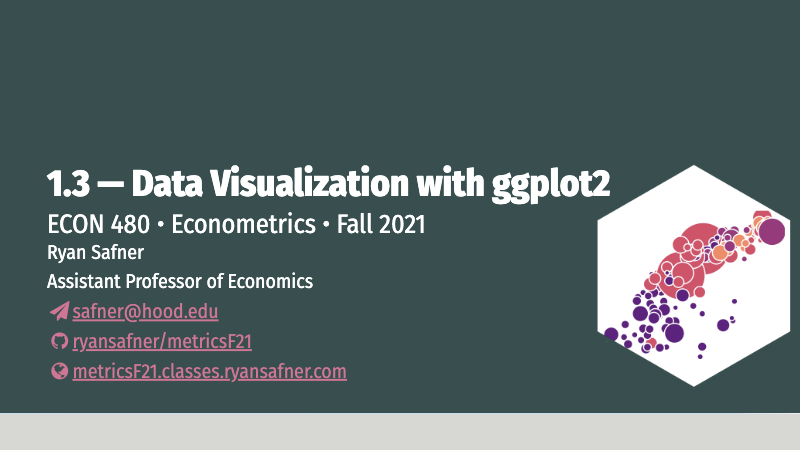
Below, you can find the slides in two formats. Clicking the image will bring you to the html version of the slides in a new tab. Note while in going through the slides, you can type h to see a special list of viewing options, and type o for an outline view of all the slides.
The lower button will allow you to download a PDF version of the slides. I suggest printing the slides beforehand and using them to take additional notes in class (not everything is in the slides)!
R Practice
Answers from last class’ practice problems on base R are posted on that page. Today you will be working on R practice problems on data visualization. Answers will be posted later on that page.
Assignments
Preliminary Statistics Survey
“Answers” for the statistics survey have been posted, including some summaries of how your classmates feel.
Additional Useful Information
New Packages Mentioned
Learn more about each of these in context in the slides, but below are links to each packages’s online help pages, which include descriptions of how each function works, examples, and cheatsheets to help you
ggplot2a grammar of graphics for plotting
You can find a running list of packages we use in this course in the resources pages.
ggplot2 Extensions
I have put up an additional resources page on packages that extend ggplot2 in various ways, as well as some ways to diagnose and improve several data visualization challenges.
